Graph Stats Panel
The Graph Stats panel shows live metrics for the currently indexed graph. Open it with Travsr: Graph Stats from the command palette, or click the status bar item.
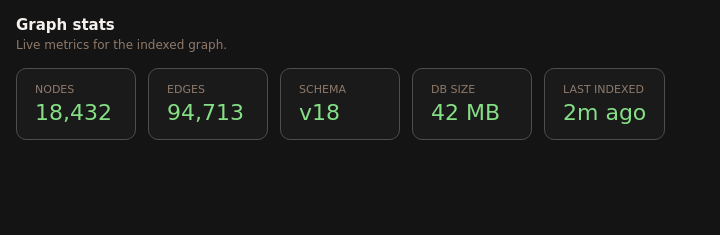
Metrics
| Card | Description |
|---|---|
| Nodes | Total number of symbol nodes in the graph (classes, functions, methods, imports) |
| Edges | Total number of edges (call edges, dependency edges, type references) |
| Schema | Graph database schema version. Migrations run forward automatically when the daemon opens a graph built by an older version. If travsr status warns that the index predates the current signature format, run travsr init to rebuild it |
| DB size | Size of the .travsr/graph.db SQLite file on disk |
| Last indexed | Time since the most recent index run (incremental or full) |
Refresh
Click Refresh to re-read the metrics from the daemon without reindexing.
Status bar shortcut
The status bar item shows a compact summary:
Travsr · fresh · 18.4k nodes
Clicking it opens this panel.